New in the Nirvana API: Per-VM Metrics and Resource Filtering
 April Wong
TL;DR
- Every VM now reports CPU, memory, disk and network metrics, live in the Dashboard and over the API. Periods from 5m to 24h, mean/max/min aggregation, 30 days of history.
GET /v1/compute/metric_descriptorscatalogues every metric we publish. Read it instead of hardcoding: new metrics land there first.- Per-VM disk charts mean you can watch real read/write rates against your ABS baseline of 20,000 sustained IOPS, no agent installed.
- Every list endpoint now takes filters and sorting via query params: Compute, Networking, NKS, Blockchain/RPC, and all account-level lists. Dashboard rollout is gradual.
- Shipped the boring way: two weeks of the collector in production and a 48-hour soak before GA.
Two features shipped in August, both in the API first: per-VM resource metrics, and filtering with sorting on every list endpoint.
Per-VM metrics, in the Dashboard and over the API
Every VM on Nirvana now reports resource metrics: CPU used and utilization, memory used and utilization, disk throughput and disk operations, network throughput. They're live in the Dashboard on each VM's detail page, and they're live in the API.
The endpoint is GET /vms/{id}/metrics, and it takes two parameters:
period:5m,15m,1h,6h,24h(default5m)aggregation:mean,max,min(defaultmean)
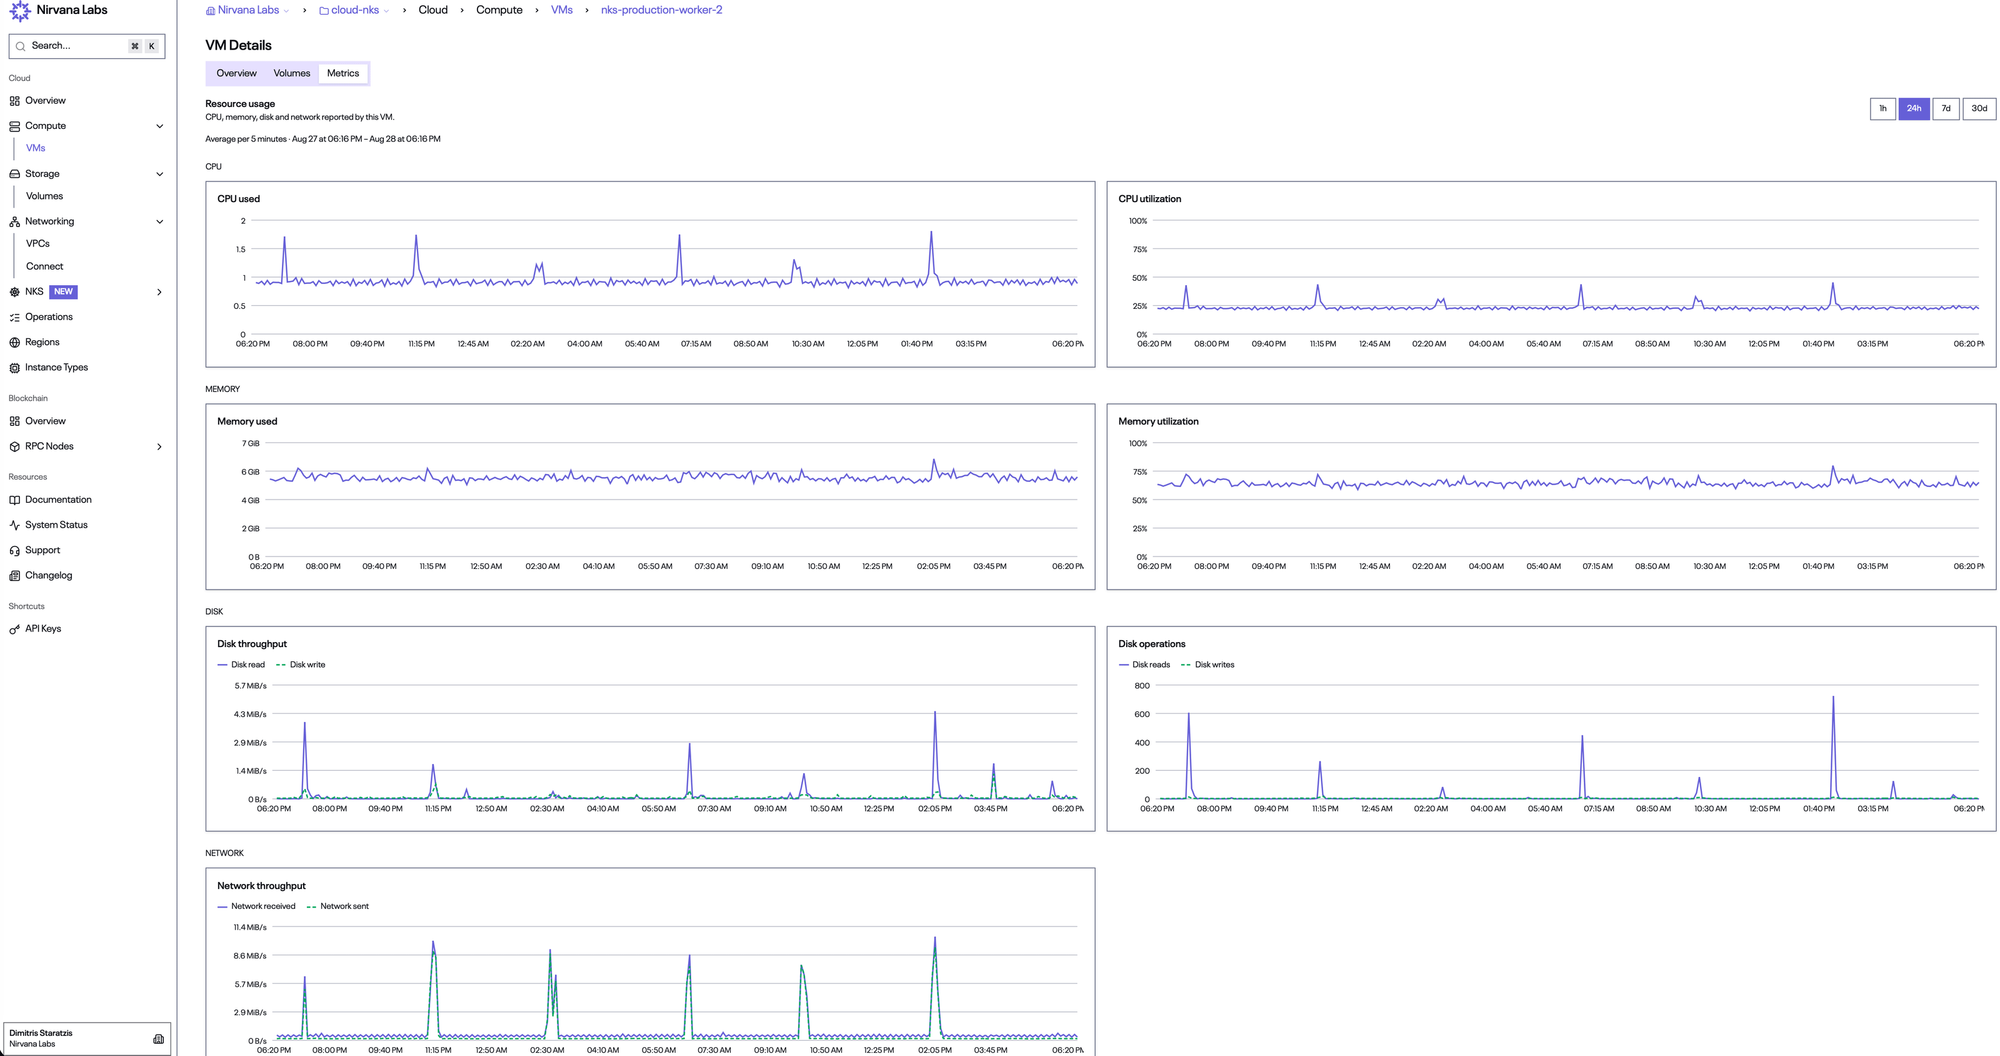
We keep 30 days of history.
There's one more endpoint worth knowing: GET /v1/compute/metric_descriptors, a catalogue of every metric we publish, with the unit and description for each. Read that rather than hardcoding the list: new metrics land there first.
On how it shipped: the collector ran in production for two weeks before we exposed anything, and the endpoints passed a 48-hour production soak before GA. Boring rollouts are a feature.
The chart we care about most
Per-VM disk operations show your actual read and write rates against what your storage delivers. ABS gives every volume 20,000 sustained IOPS as the baseline; now you can see how much of it you use.
Filtering and sorting on every list endpoint
Every list endpoint in the API now accepts filters and sorting via query parameters.
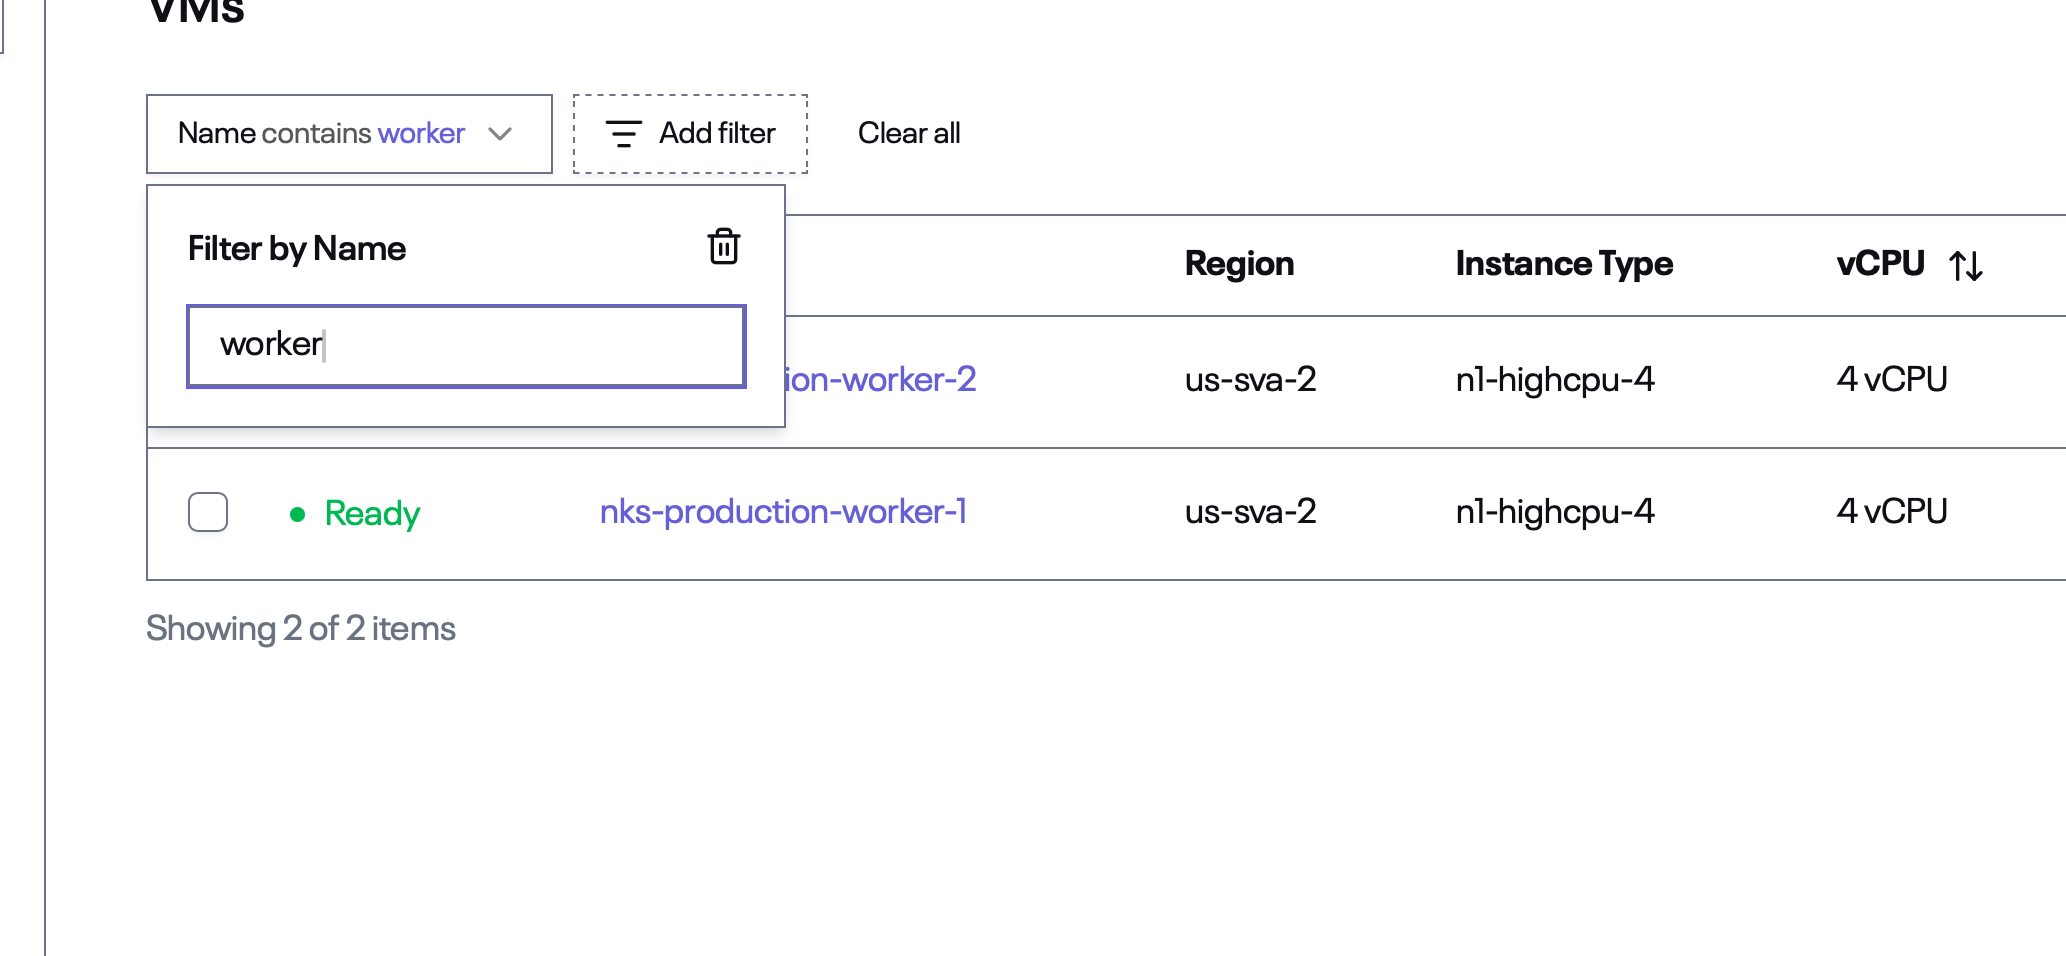
It's live across Compute, Networking, NKS and Blockchain/RPC, plus the account-level lists: projects, API keys, audit logs, operations, usage, billing history, quotas, regions, organizations and memberships.
"Every VM with worker in the name" used to mean fetching pages and filtering client-side. Now it's a query parameter, and the same pattern works on your audit logs and billing history as on your VM fleet.
The Dashboard is picking the same capability up gradually: the VMs list already has it, with more list views enabling over the coming weeks.
What's next
Metrics tell you what each machine is doing; filtering lets you ask about the fleet in one query. Find, check, act: all through the API.
Console charts for more views are next, and new metrics will keep landing in metric_descriptors first.
Try it: sign up at nirvanalabs.io or read the API docs for the full parameter reference.
About Nirvana Labs
Nirvana Labs is a high-performance storage cloud purpose built for blockchain, AI and databases i.e. the most demanding, real-time, stateful workloads. Accelerated Block Storage (ABS) offers 20K baseline IOPS included, no over provisioning. Nirvana Kubernetes Service (NKS) with Karpenter auto-scaling, high clock-speed compute and private networking. Backed by Jump Trading, Crucible, etc with 50+ customers live in production today.
Learn more at Nirvana Labs
Nirvana Cloud | Pricing | Blog | Docs | Changelog | LinkedIn |Twitter | Telegram| YouTube
Related Posts
The expensive way to buy IOPS
If your storage bill is mostly meter, you paid the expensive way. Clouds price capacity cheap and meter IOPS on top: 60% of the bill at 20K IOPS, 84% at 80K, 91% on io2. Which workloads hit the meter, what it costs them, and whether yours should move.
Agent economics: the sandbox chapter
Storage-backed sandboxes save you twice: on idle, and on work you never redo. Fast disks. Persistent workspaces. Isolated sandboxes. And you pay for the work once. Run your agents on Nirvana.
Why Nirvana is the best place to run your AI agents
Nirvana is the best place to run your AI agents. Faster storage, a smaller bill, and more billable work out of the same agents.
Powering AI, blockchain, and
databases
