Understanding Latency Metrics: P90, P95, P99 Explained
 April Wong
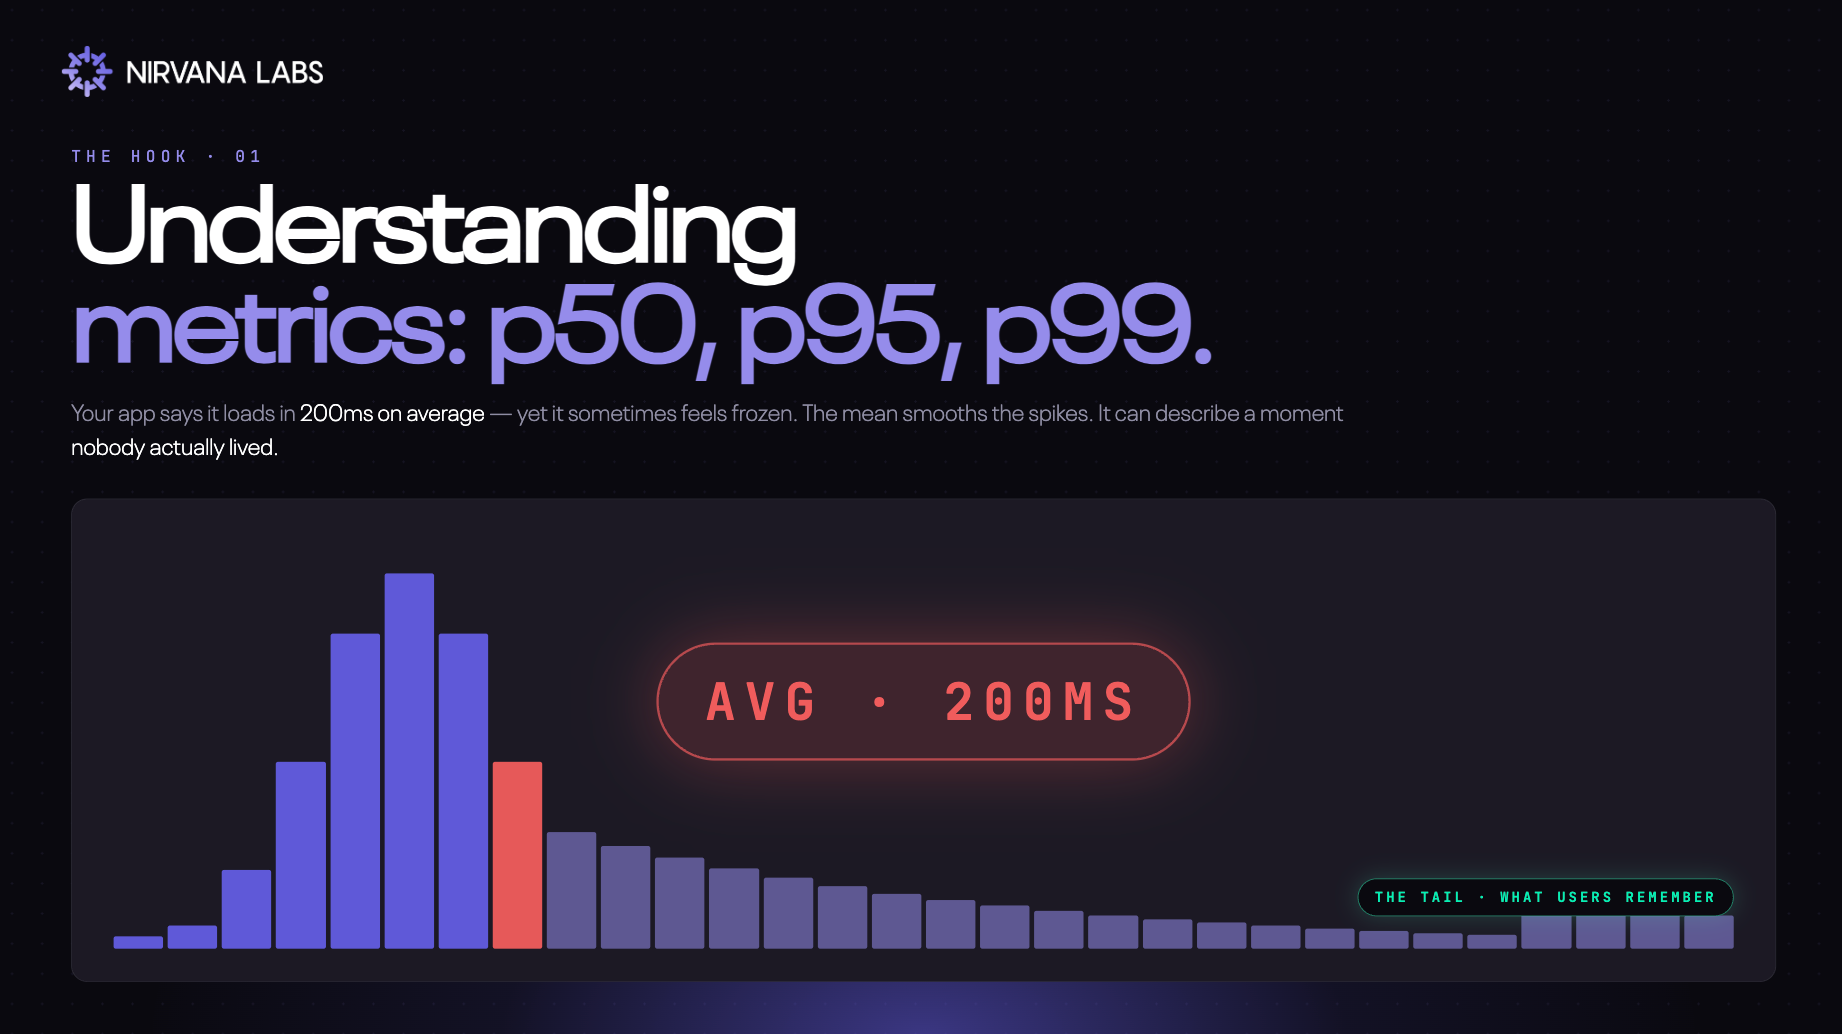
Learn what p90, p95, and p99 latency mean, why the average hides your slowest users, and which percentile matters most for your system.
TL;DR:
- Percentiles sort requests from fastest to slowest: p90, p95, and p99 show what different slices of users feel.
- p99 matters most when slowness compounds - distributed systems, AI agents, anything that makes many calls per request.
- Report all three, not just one.
You've probably had this experience. An app freezes, a page won't load, a checkout button just spins. You check the company's status page - everything's green. So why are you the one stuck?
You're probably experiencing a p99.
What does that mean? Let's break it down.
What is latency?
Latency is the time between a request being made and a response coming back. When you click a button, send an API call, or query a database, latency is the wait.
It's usually measured in milliseconds (ms) or seconds. Lower latency means the system feels snappy. Higher latency means it feels sluggish or broken.
So how do you measure it well? Not with averages.
The average doesn't represent any real user
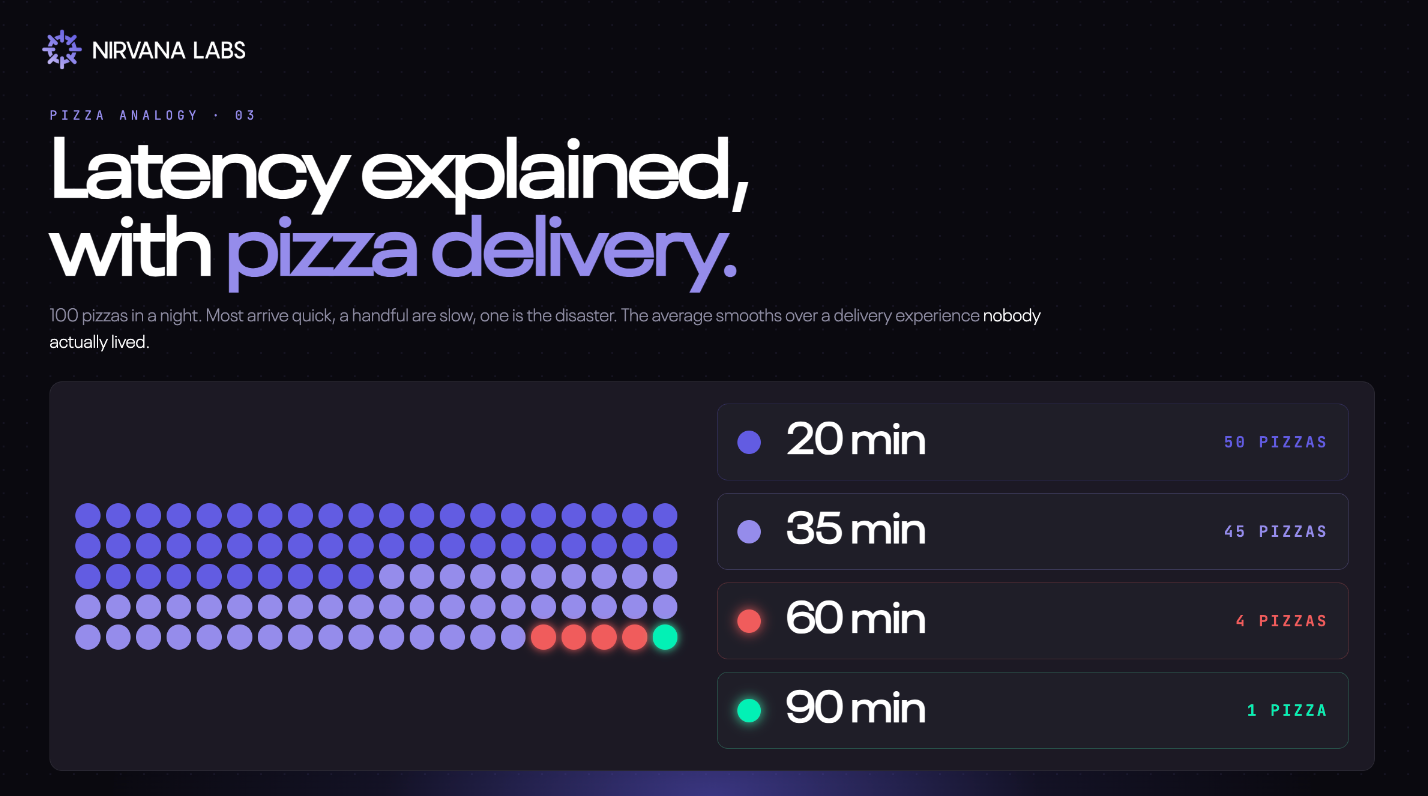
Imagine a pizza place that delivers 100 pizzas in a night:
- 50 arrive in 20 minutes ← p50 = 20 min (half are this fast or faster)
- 45 arrive in 35 minutes ← p95 = 35 min (95 of 100 are this fast or faster)
- 4 arrive in 60 minutes ← p99 = 60 min (99 of 100 are this fast or faster)
- 1 takes 90 minutes ← the tail (worse than p99)
The average delivery time is 29~ minutes. Nobody actually got a 29-minute pizza. The average is a number that didn't happen to anyone.
Worse, it hides the one customer who waited 90 minutes and is never ordering again.
This is exactly what's happening every time someone reports "average response time: 200ms." It tells you almost nothing about what real users experience.
Percentiles, in plain English
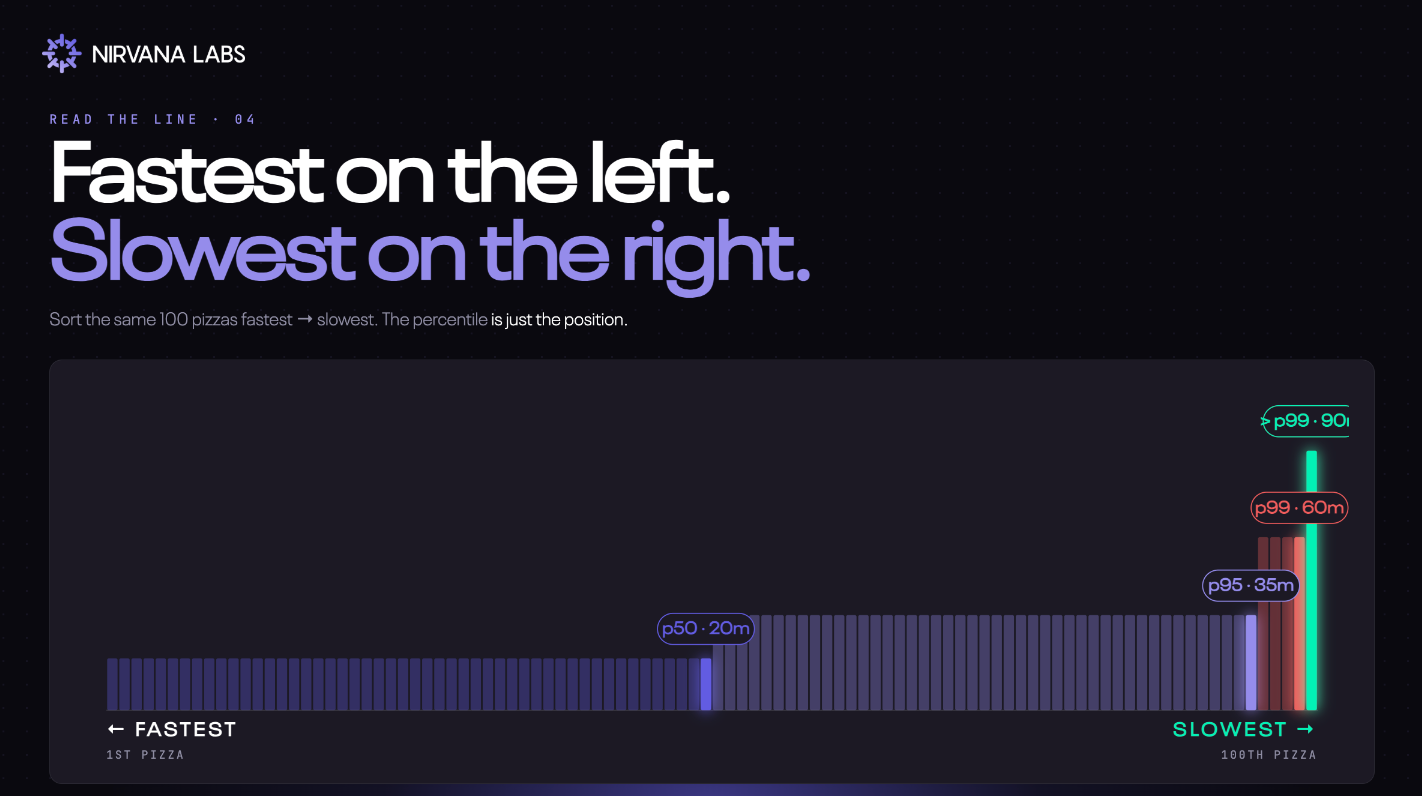
Engineers measure latency with percentiles instead. The idea is simple: sort every request from fastest to slowest, then walk down the line.
- p90: 90% of requests are faster than this number. Only 10% are slower.
- p95: 95% are faster. Only 5% are slower.
- p99: 99% are faster. Only 1% are slower - the unlucky tail.
A concrete example. Say your API receives 100 requests:
- 90 of them respond in under 80ms → your p90 is 80ms
- 95 of them respond in under 90ms → your p95 is 90ms
- 99 of them respond in under 120ms → your p99 is 120ms
You can see at a glance how the experience changes depending on which slice of users you're looking at. The average smushes all of this into one fake number.
Which percentile actually matters?
It depends on what you're building.
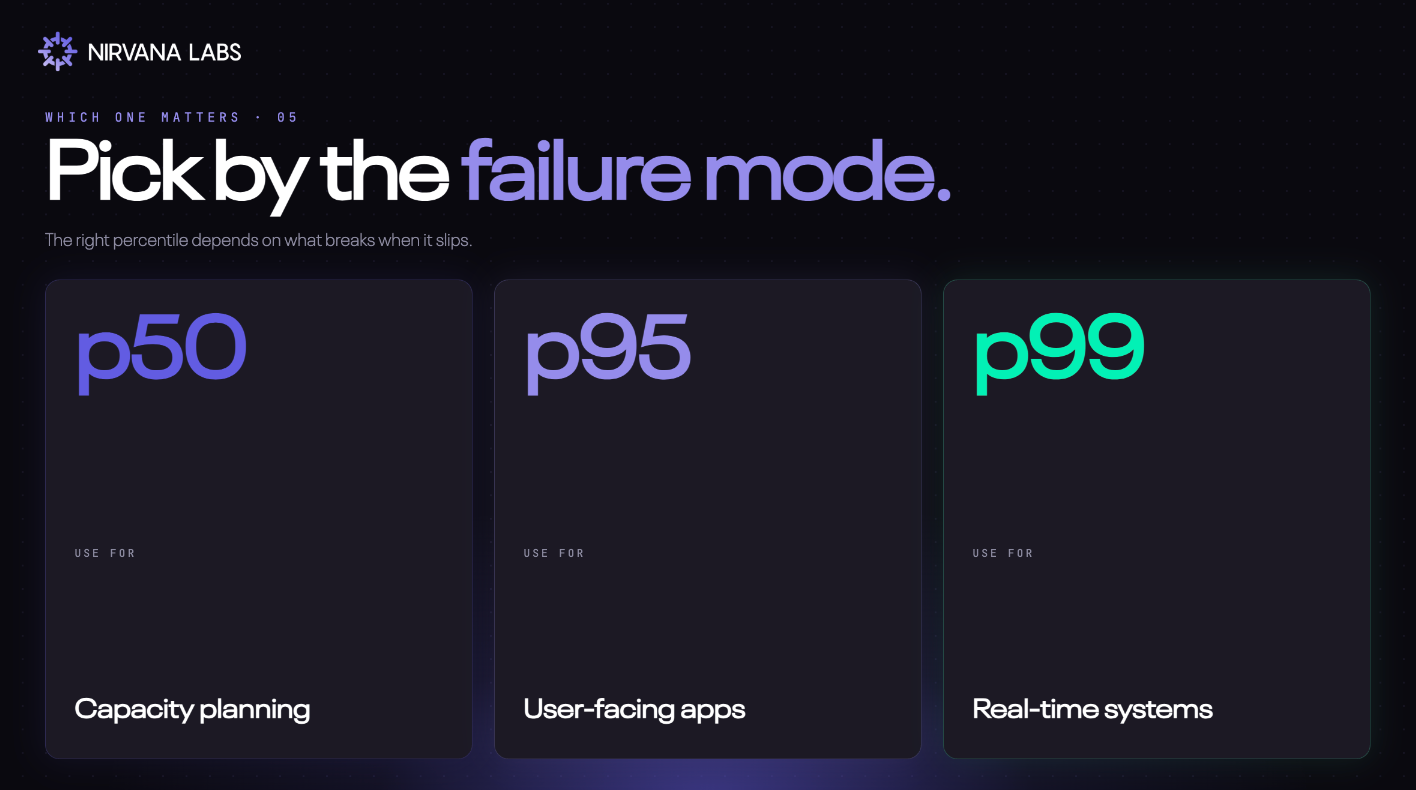
p90 and p95 are the sweet spot for most user-facing applications. They capture the experience of the vast majority of users without being dragged around by rare freak events. If you're setting an SLA for a typical web API, this is usually where you set the bar.
p99 (and p99.9) matters most when slowness compounds and this is where it gets interesting for modern workloads.
Why p99 eats distributed systems alive
In a single, simple request, p99 affects 1% of users. Annoying, but contained.
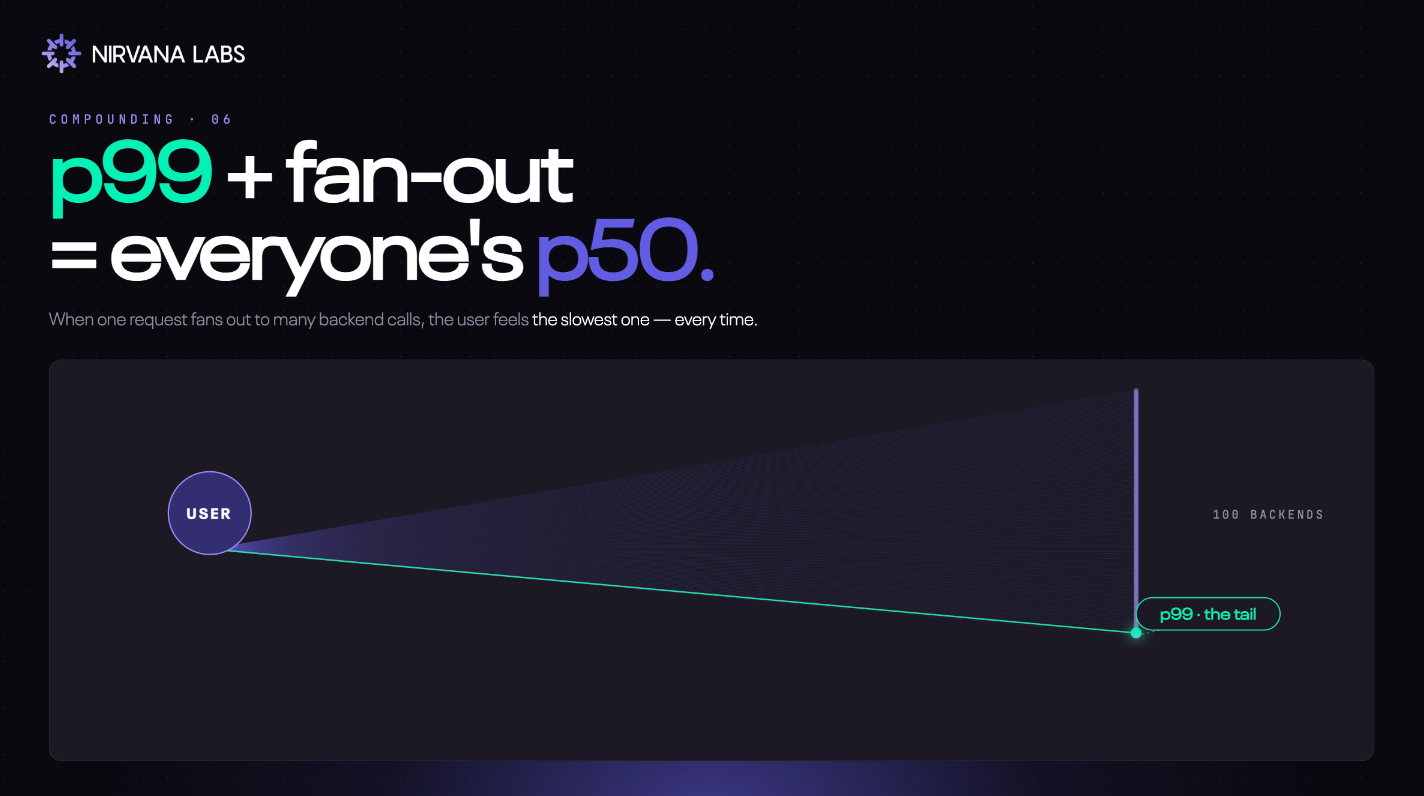
In a distributed system, that 1% gets multiplied. If a single user request fans out to 100 backend calls — say, an API hitting 100 microservices, or an AI agent making 50 sequential tool calls — the user effectively rolls the dice 100 times against your tail. The math says they'll hit your p99 on almost every page load.
Your "1% of slow requests" becomes the average user's reality.
This is why p99 is the metric that matters for trading platforms (where slow trades are lost trades), multiplayer games (where lag is unplayable), and AI agents (where every step rolls the dice again). When slowness compounds, the tail isn't a rare problem. It's the product.
The takeaway
Don't pick one percentile. Report all three.
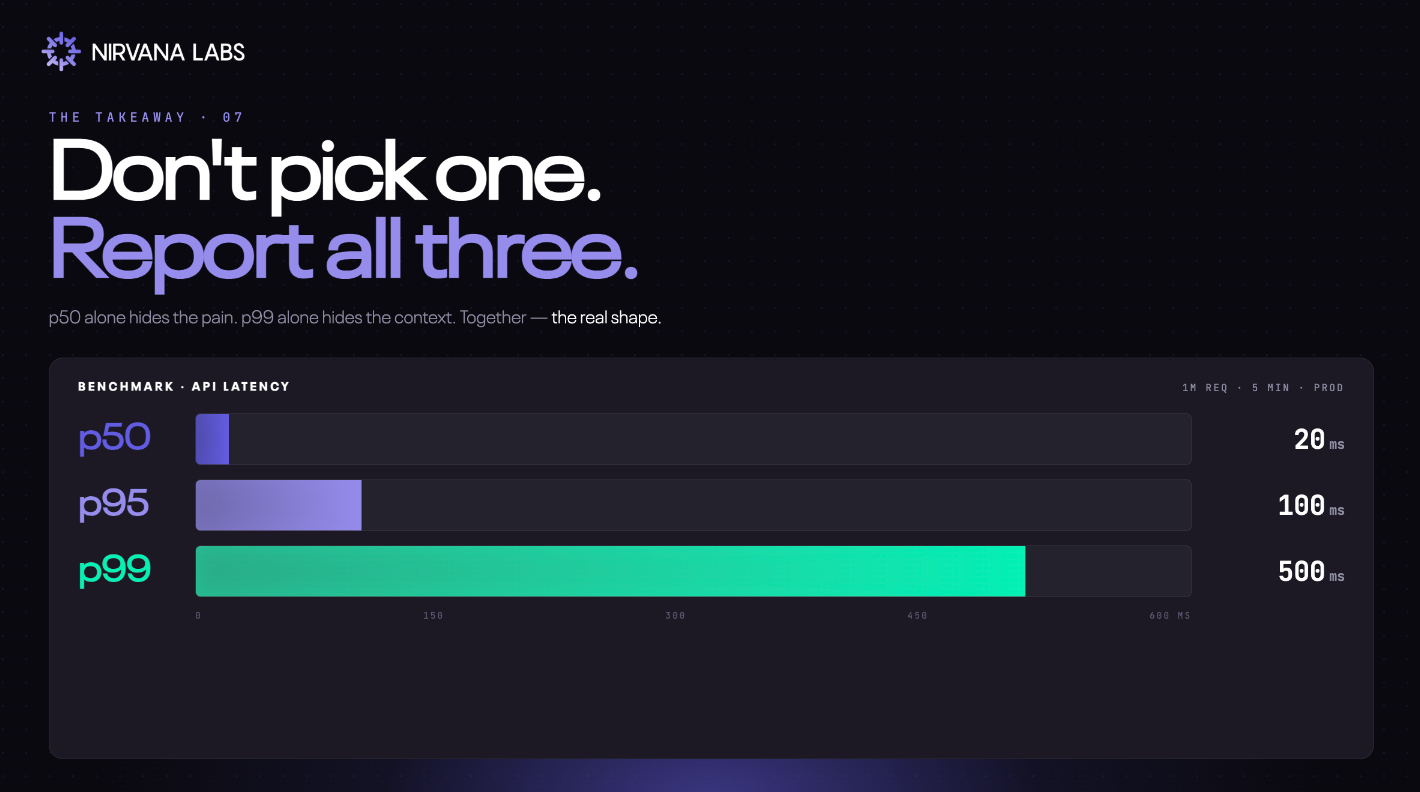
p50 alone hides the pain. p95 shows what most users feel. p99 alone hides the context. Together they show the real shape of how your system behaves under real load.
And this matters all the way down the stack — including storage, where the percentiles of the layer underneath directly shape the percentiles your users feel.
So next time an app freezes while the status page says everything's fine, you'll know what's actually happening. You're the unlucky 1%. You're the p99.
Nirvana: Modern Cloud for Real-time Workloads
High Clock Speed Compute. Low Latency Storage. Radically Cheaper Bandwidth.Powering Web3, AI, and real-time systems.
Learn more at Nirvana Labs
Nirvana Cloud | Pricing | Blog | Docs | Changelog | Twitter | Telegram | LinkedIn
Related Posts
Managed ClickHouse, Explained: the options and what actually decides performance
Managed ClickHouse, Explained: the options and what actually decides performance
Object, File, and Block Storage: What's the Difference
Object, File, and Block Storage: What's the Difference
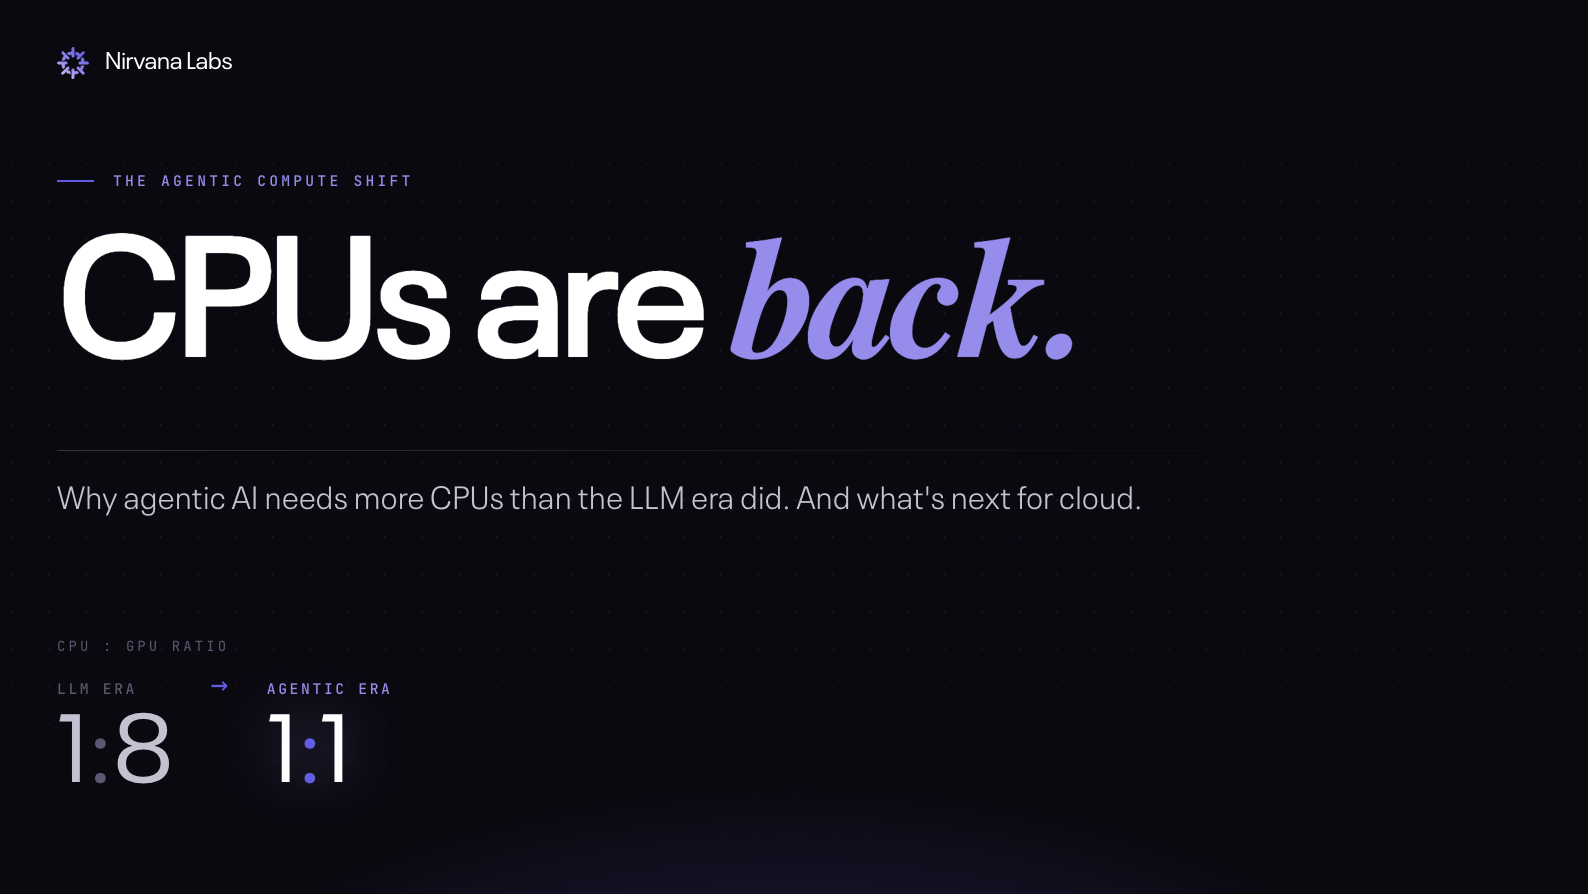
CPUs are back: Why agentic AI needs more CPUs than GPUs, and what's next for cloud
CPUs are back: Why agentic AI needs more CPUs than GPUs, and what's next for cloud
Powering AI, blockchain, and
databases
